Where does Maricá need attention first? (2/3): the map the average hides
Part 2 of the series on the ICST of Maricá (RJ, Brazil). The index ranges from 30.9 to 96.1 across census tracts, sanitation is the weakest dimension and disadvantages form contiguous patches. Maps, neighborhoods and districts, with a step-by-step calculation example.

In this article
In the previous post I put the pieces together: four dimensions, ten official variables, all on a 0–100 scale where 100 is the best situation observed in the municipality. Now comes the question that matters: when we combine everything, what Maricá appears?
The index in four numbers
- The ICST was calculated for 447 tracts, which hold 97.5% of the population.
- It ranges from 30.9 to 96.1 points. That is an enormous difference within a single municipality.
- The median is 69.7 and the mean 68.9, with a standard deviation of 10.9. The distribution is roughly symmetric.
- In urban tracts the median is 69.7; in rural ones, 51.7.
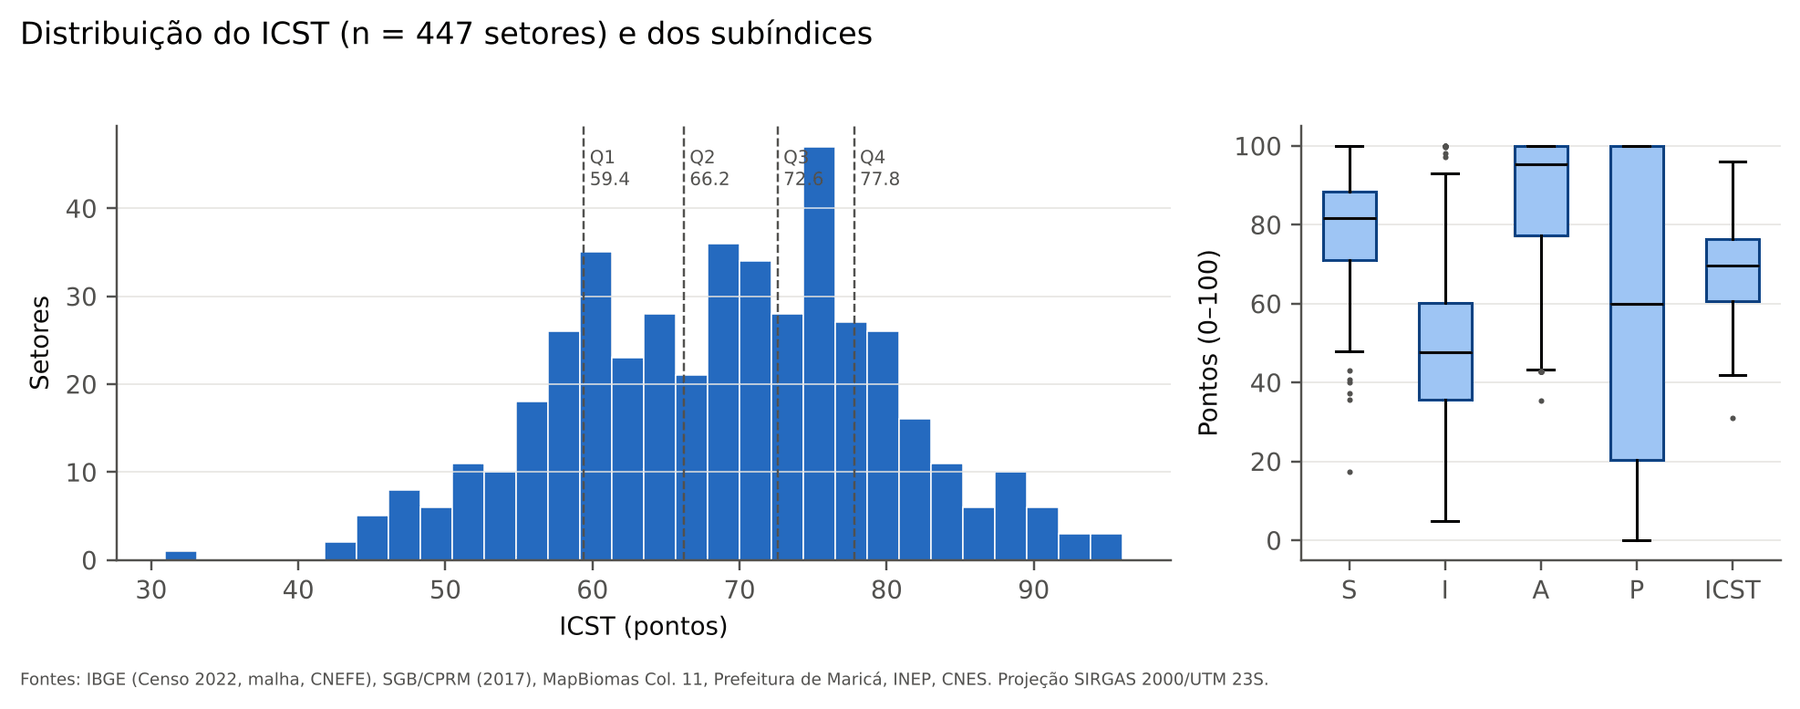
Look at the boxplots on the right. Which dimension stands out?
Infrastructure and sanitation (I) is the lowest, with a median of 47.6. Access to services (P) has a median of 60.0 but an enormous spread: there are tracts with 0 and tracts with 100. The socio-environmental (median 95.3) and socioeconomic (median 81.7) dimensions are much higher. In other words, what separates Maricá’s tracts is not so much income or literacy. It is sanitation and distance.
I also checked that the variables were not measuring the same thing twice. Correlations between variables of different dimensions are weak, which indicates little redundancy and justifies treating them as distinct axes.
The map
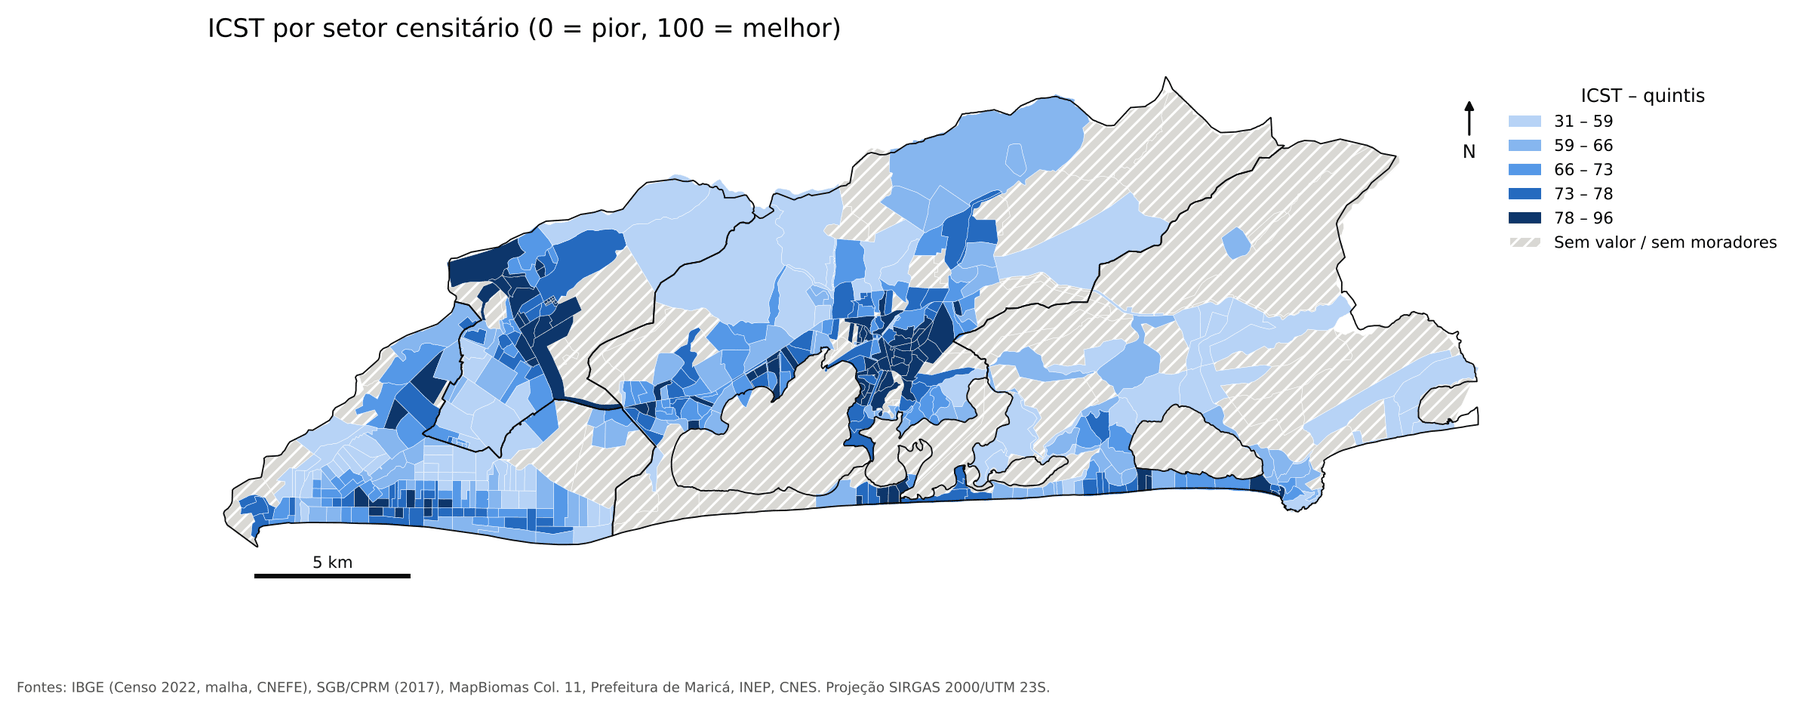
The darker, the better. The best conditions form two cores:
- the Center and neighboring neighborhoods of the 1st district (Mumbuca, Flamengo, Araçatiba);
- the Inoã and Spar axis, in the 3rd district, to the west.
These are the places where the water network, the sewage network and nearby services coincide.
The worst conditions are in the rural and peri-urban fringes of the north and east (Silvado, Cassorotiba, Retiro, Vale da Figueira, Jaconé) and in large parts of the 4th district, Itaipuaçu, where dense subdivisions have low sewage coverage and a large share of households sit in areas of high flood susceptibility.
Inside the dimensions
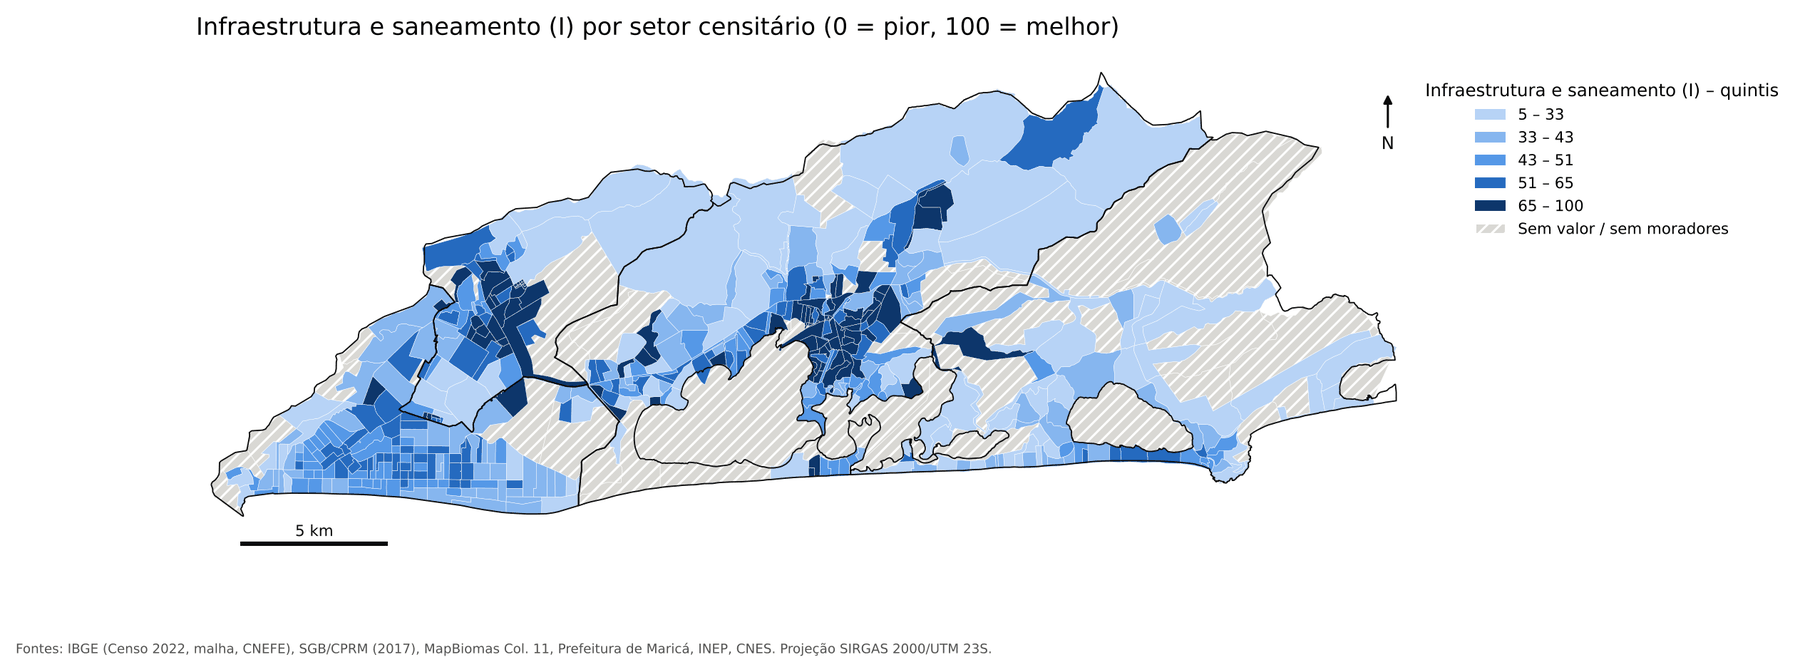
The infrastructure map explains a good part of the ICST map. Note that the darkest tones appear almost only in the Center and in Inoã:
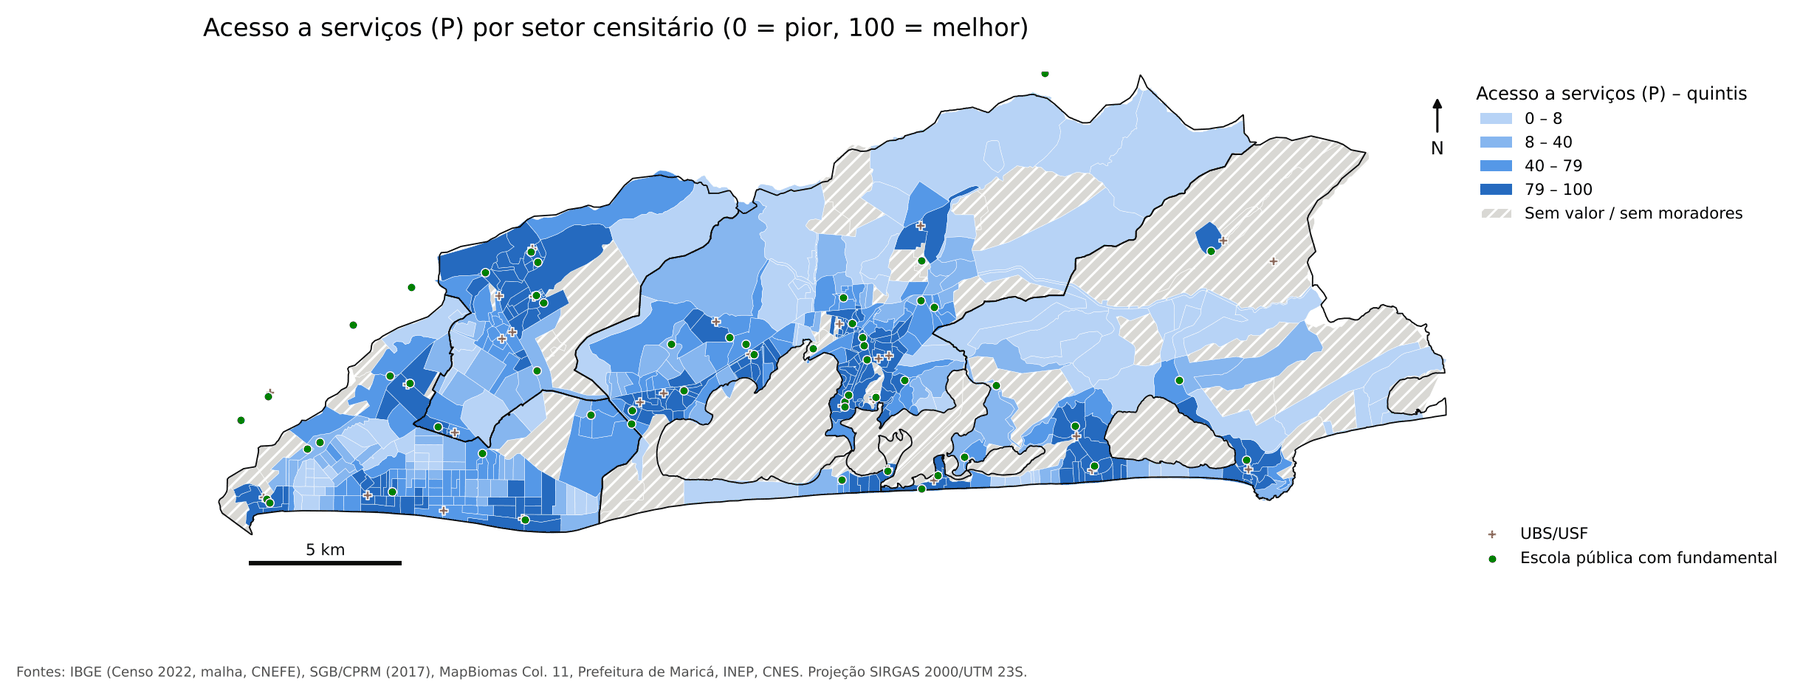
Walking access to services gives a different cut. Here I measured, along the street network, what share of each tract’s households can reach a Family Health Unit and a public school with elementary education within 20 minutes of walking (1,500 m at 4.5 km/h). The calculation used Dijkstra’s algorithm over 4,302 km of roads, starting from all facilities at once, including those in neighboring municipalities:
And the socio-environmental dimension shows where flood susceptibility weighs most, especially along the Itaipuaçu shoreline and the edges of the lagoon system:
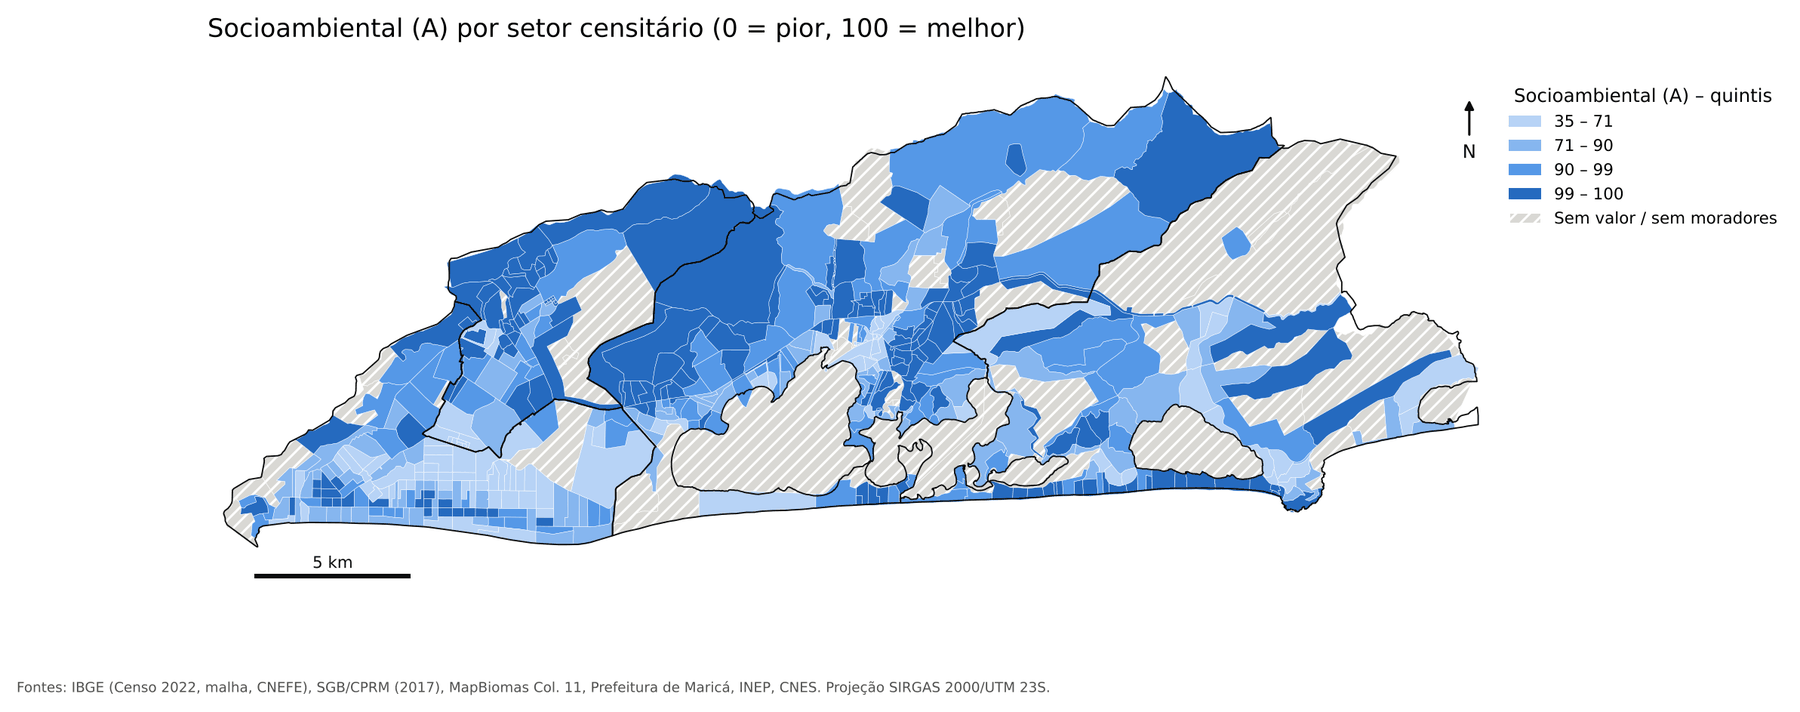
An important point for reading this last map: susceptibility is not risk. The Geological Survey of Brazil chart shows where terrain tends to flood or slide. It does not give the probability of damage to a specific house. High susceptibility to mass movement, for example, barely touches occupied areas in Maricá: 0.01% of households, in only three tracts.
Disadvantages go together
You have probably noticed that similar tracts sit next to each other. That has a name and a measure: spatial autocorrelation. The ICST’s global Moran’s I is 0.63 (p = 0.001), and all sub-indices show positive, significant autocorrelation; access is the most concentrated (0.72).
Local analysis (LISA) found 76 tracts in Low-Low clusters (low-index tracts surrounded by neighbors that are also low) and 69 in High-High clusters.
Why does this matter for public policy? Because scattered disadvantage calls for policy aimed at people; concentrated disadvantage calls for intervention by area. Extending the sewage network in a Low-Low cluster serves many households at once.
Neighborhoods and districts
Aggregating the tracts (summing numerators and denominators, never averaging percentages), the districts look like this:
| District | Population | S | I | A | P | ICST |
|---|---|---|---|---|---|---|
| 3rd District of Inoã | 35,593 | 70.8 | 62.9 | 93.7 | 71.0 | 74.2 |
| 1st District, Seat (Center) | 75,488 | 81.1 | 53.6 | 93.4 | 67.1 | 73.8 |
| 4th District of Itaipuaçu | 59,404 | 85.5 | 45.8 | 82.2 | 48.4 | 67.2 |
| 2nd District of Ponta Negra | 22,390 | 75.3 | 33.4 | 88.8 | 56.3 | 63.3 |
Look at Itaipuaçu: it has the highest socioeconomic sub-index of the four districts (85.5) and yet only the third-highest ICST. What drags it down is infrastructure, access and flooding. This is the kind of reading an income-only index would never give.
Among neighborhoods with at least 500 inhabitants:
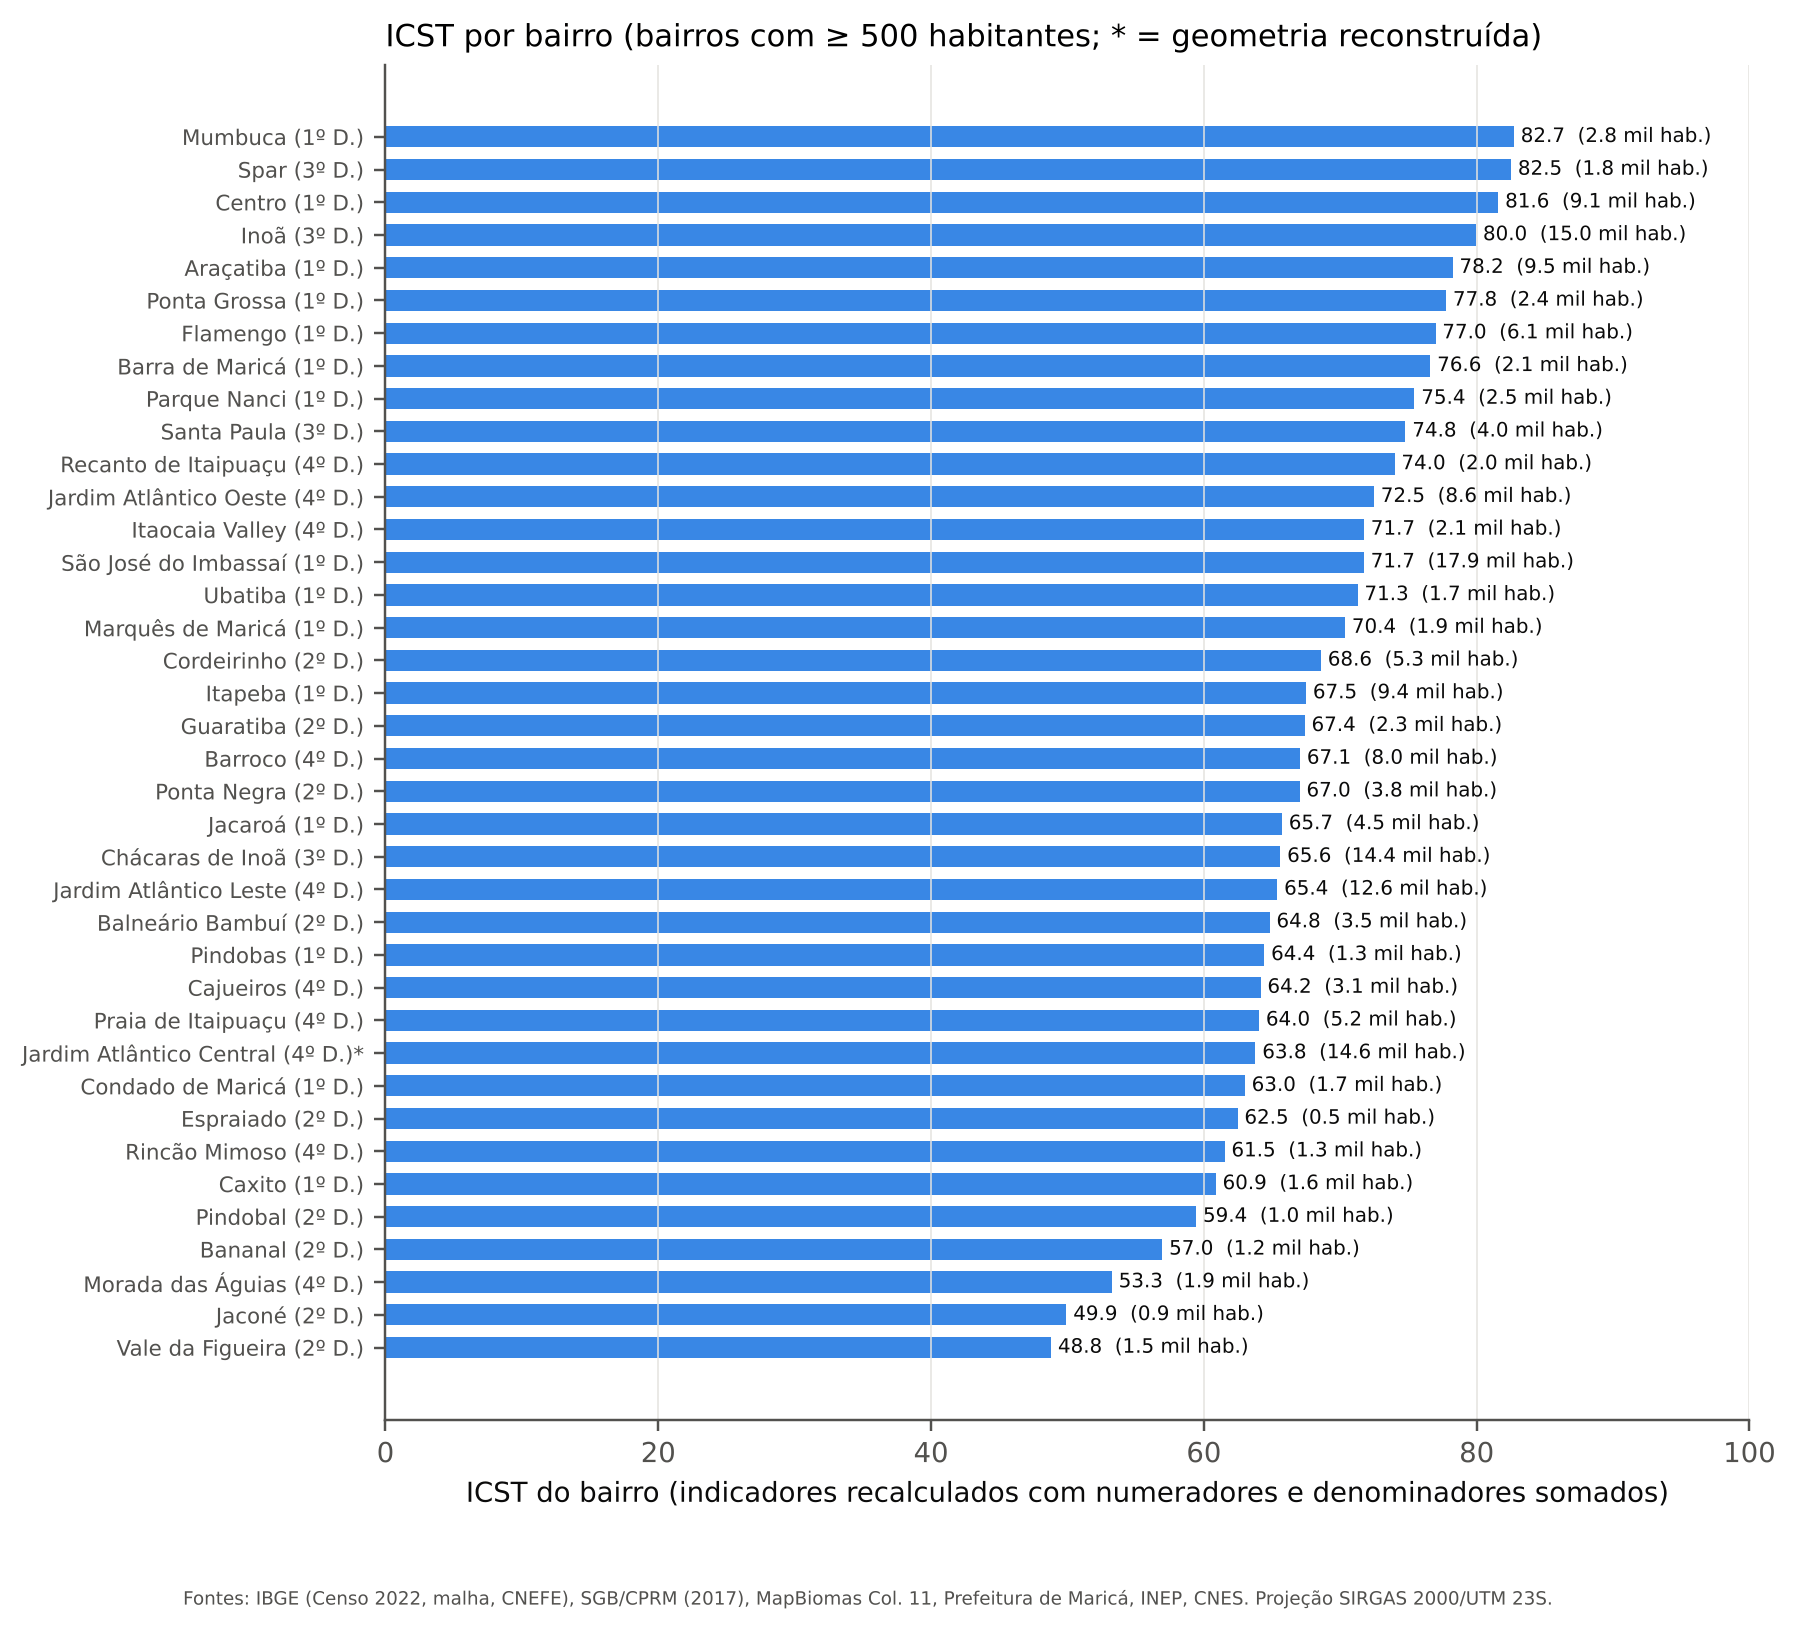
- Highest values: Mumbuca (82.7), Spar (82.5), Centro (81.6), Inoã (80.0) and Araçatiba (78.2).
- Lowest values: Vale da Figueira (48.8), Jaconé (49.9), Morada das Águias (53.3), Bananal (57.0) and Pindobal (59.4).
The worst-performing neighborhoods combine low infrastructure with poor access. In the Itaipuaçu shoreline neighborhoods, flood susceptibility weighs most. A caveat: Jardim Atlântico Central appears with an asterisk because the City Hall service returns that neighborhood without geometry. I rebuilt the area as the part of the 4th district not covered by the other neighborhoods.
An index you can check by hand
Composite indices have a reputation as black boxes. To avoid that, the paper details the calculation for three real tracts, chosen by an objective criterion: the 10th percentile, the median and the 90th percentile. For each variable I show the raw value, the normalization limits, the normalized value, the weights and the contribution to the index. The sum of contributions reproduces the tract’s ICST, differing only by rounding.
The chart below compares the profiles of those tracts, together with the municipality’s minimum and maximum:
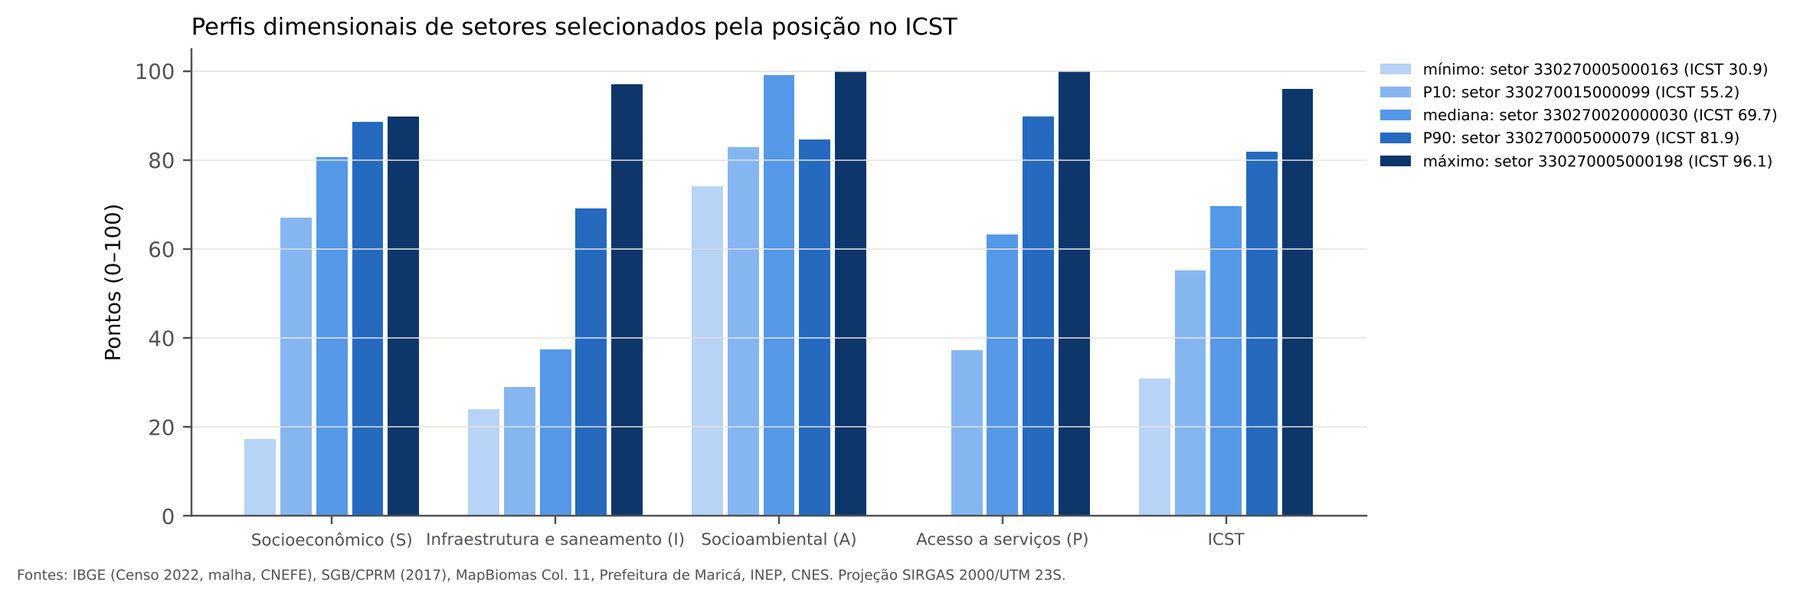
Read the infrastructure (I) bars: from the P10 tract (29.1) to the P90 tract (69.2), infrastructure more than doubles. In the minimum tract (ICST 30.9, a small tract with 123 residents), the problem is not just one: socioeconomic 17.3, infrastructure 23.9 and walking access to services equal to zero.
There is also the opposite case. The weighted sum allows compensation between dimensions: 19 tracts are in the top two ICST quintiles but have at least one dimension in the worst decile, almost always the socio-environmental one (tracts in the Center and Ponta Grossa on the lagoon shore) or the socioeconomic one (parts of Inoã and Chácaras de Inoã). For those places, a high overall index should not hide the critical sub-index.
In the last post, I turn the map into a list: which tracts are priorities, how many people live in them and why that choice can be trusted. And I explain why the Census says 35% of households have network water while the national sanitation system says 78%.