Where does Maricá need attention first? (3/3): priorities that survive testing
Final part of the series on the ICST of Maricá (RJ, Brazil). 78 robust priority tracts, with 27,683 residents (14% of the population), concentrated in Itaipuaçu, Chácaras de Inoã and the fringes of the 2nd district. How I tested the stability of that list, why the Census shows 35% network water and SINISA 78%, and what the index does not say.

In this article
In the previous two posts I built the Socioterritorial Conditions Index for Maricá and showed the map that comes out of it: a municipality with tracts between 30.9 and 96.1 points, sanitation as the main deficit and disadvantages concentrated in patches.
A good-looking map, though, is not yet a decision. A manager will ask: where do I start? And right after: if you had chosen other weights, would the answer be the same?
This post answers both questions and resolves a discrepancy that, left unexplained, would undermine confidence in everything else.
Priority, yes. But robust?
Being in the worst quintile (the 20% of tracts with the lowest ICST) is the first criterion. But a tract can be in the worst quintile because of a weighting detail. So I defined a robust priority tract as one that is in the worst quintile and stays there in at least 80% of 1,000 weight draws, in which each weight varies randomly by up to 20% up or down.
The result:
- 78 robust priority tracts, with 27,683 residents, or 14.0% of Maricá’s population.
- 54 of them are also in Low-Low clusters, that is, surrounded by equally disadvantaged tracts.
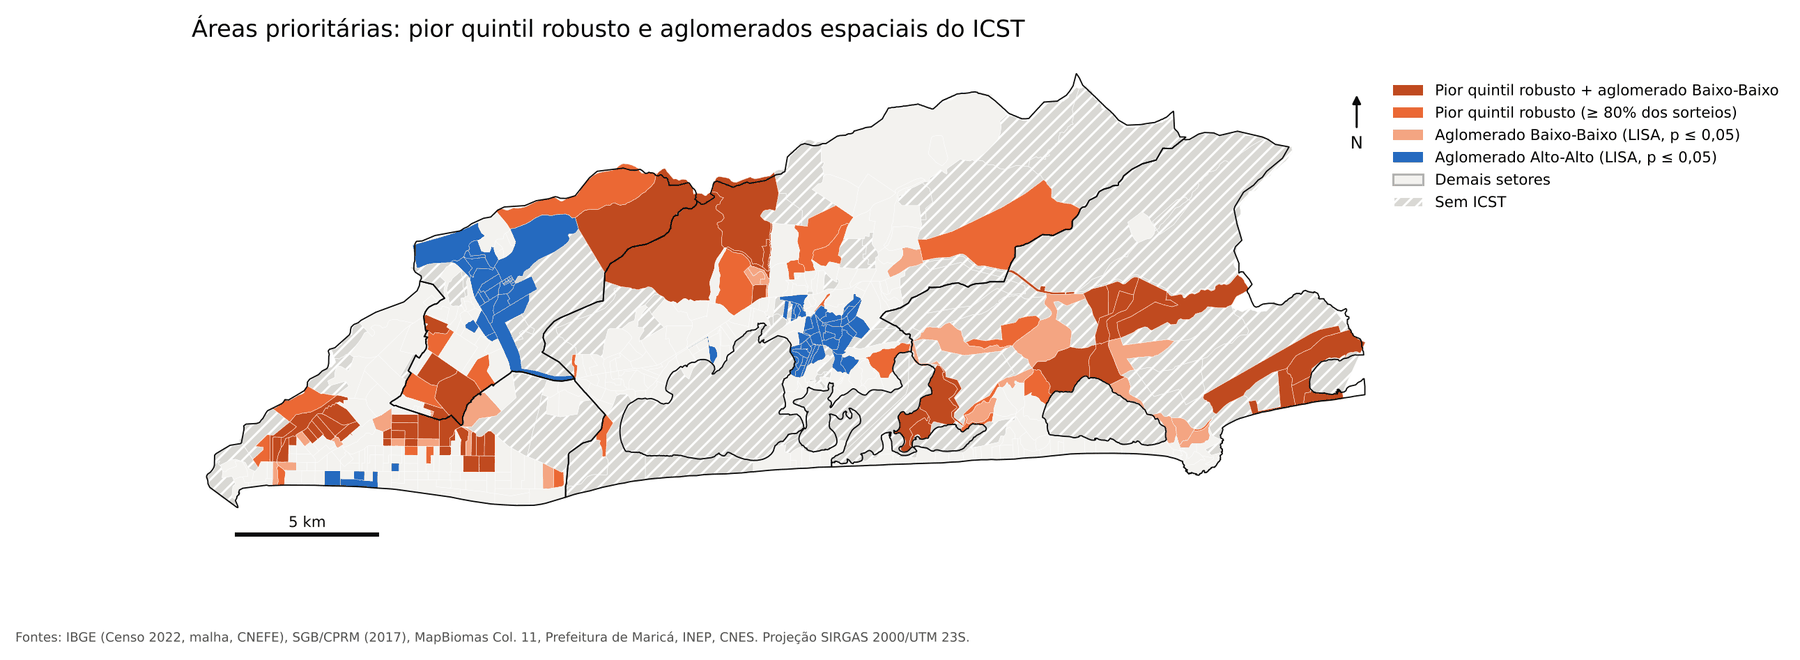
By population, the largest groups are in:
| Neighborhood | Priority tracts | Residents |
|---|---|---|
| Jardim Atlântico Central (4th D.)* | 9 | 4,912 |
| Chácaras de Inoã (3rd D.) | 7 | 3,471 |
| Jardim Atlântico Leste (4th D.) | 7 | 2,874 |
| Morada das Águias (4th D.) | 5 | 1,988 |
| Barroco (4th D.) | 3 | 1,921 |
| Vale da Figueira (2nd D.) | 5 | 1,478 |
That is: Itaipuaçu, Chácaras de Inoã and the fringes of the 2nd district.
What do these tracts have in common? The lowest dimensions are access to services (mean of 17.3, versus 56.4 across all tracts) and infrastructure (33.3, versus 49.4). It is a combination of missing sewage and water networks with health units and schools far away on foot. A word of honesty: 9 of these tracts have fewer than 20 household heads, which makes the income estimate unstable, and they should be read with caution.
Testing the index itself
Would you trust a priority list that changes completely if someone tweaks the weights? I would not. So I tested it in two ways, following the classic roadmap from the composite-indicator literature.
First, the 1,000 weight draws. The Spearman correlation between each drawn ranking and the baseline ranking was between 0.982 and 1, with a median of 0.995. In practice, the order of the tracts barely changes.
Second, 16 alternative scenarios, in which I changed one decision at a time: equal weights, a different normalization, a different definition of adequate sewage, a different walking time, a different occupancy mask, a different income line.
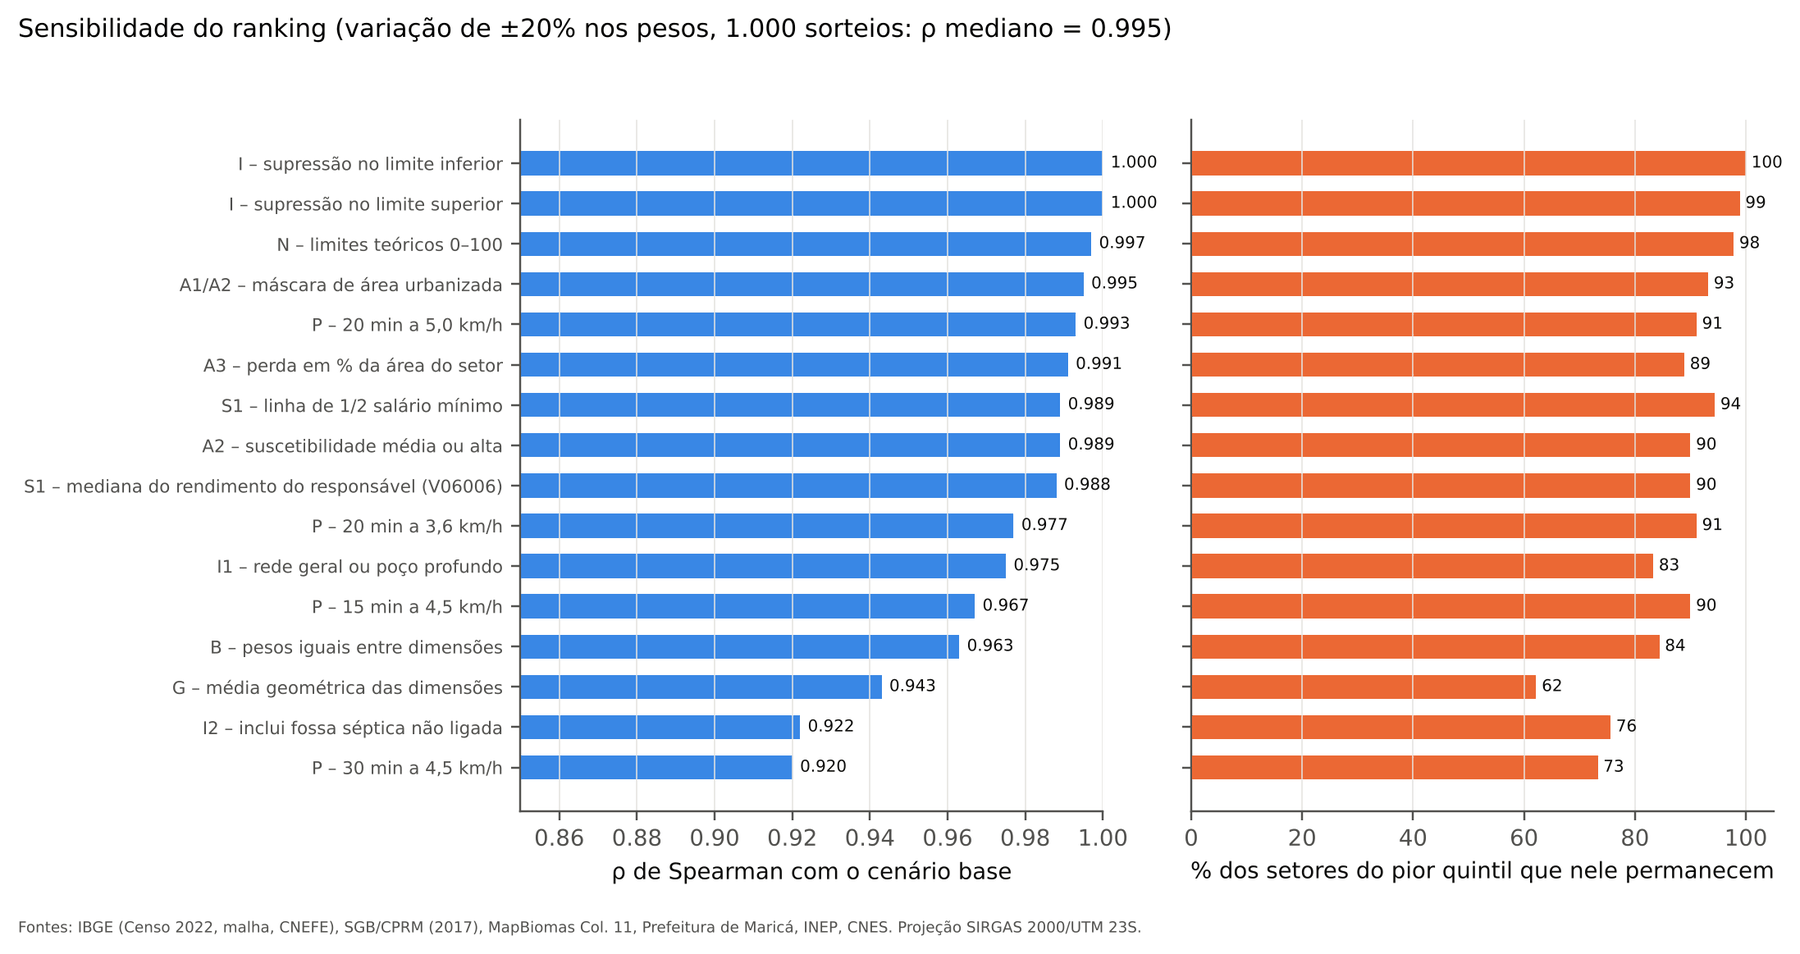
What the chart tells us:
- Almost nothing changes: the treatment of cells suppressed by IBGE (ρ = 1.000) and normalization by theoretical 0–100 limits (ρ = 0.997).
- More changes: counting a septic tank not connected to the network as adequate sewage (ρ = 0.922), extending the walking time to 30 minutes (ρ = 0.920) and replacing the weighted sum with a geometric mean, which reduces compensation between dimensions (ρ = 0.943).
Even in the most influential scenarios, between 62% and 100% of the worst-quintile tracts remain in it. The most sensitive choices are precisely those with legitimate technical debate (what counts as adequate sewage? how far is it reasonable to walk to a USF?), and the manager should know that.
The mystery of 35% versus 78%
Now the discrepancy. The 2022 Census says 35.2% of Maricá’s households have the public network as their main source of water. SINISA, the national sanitation information system, says 78.3% of the population is served by the network in 2024.
If two official sources disagree this much, which one should you believe? And if the Census were wrong, the ICST water indicator would be wrong too.
I went looking, and the difference has three explanations:
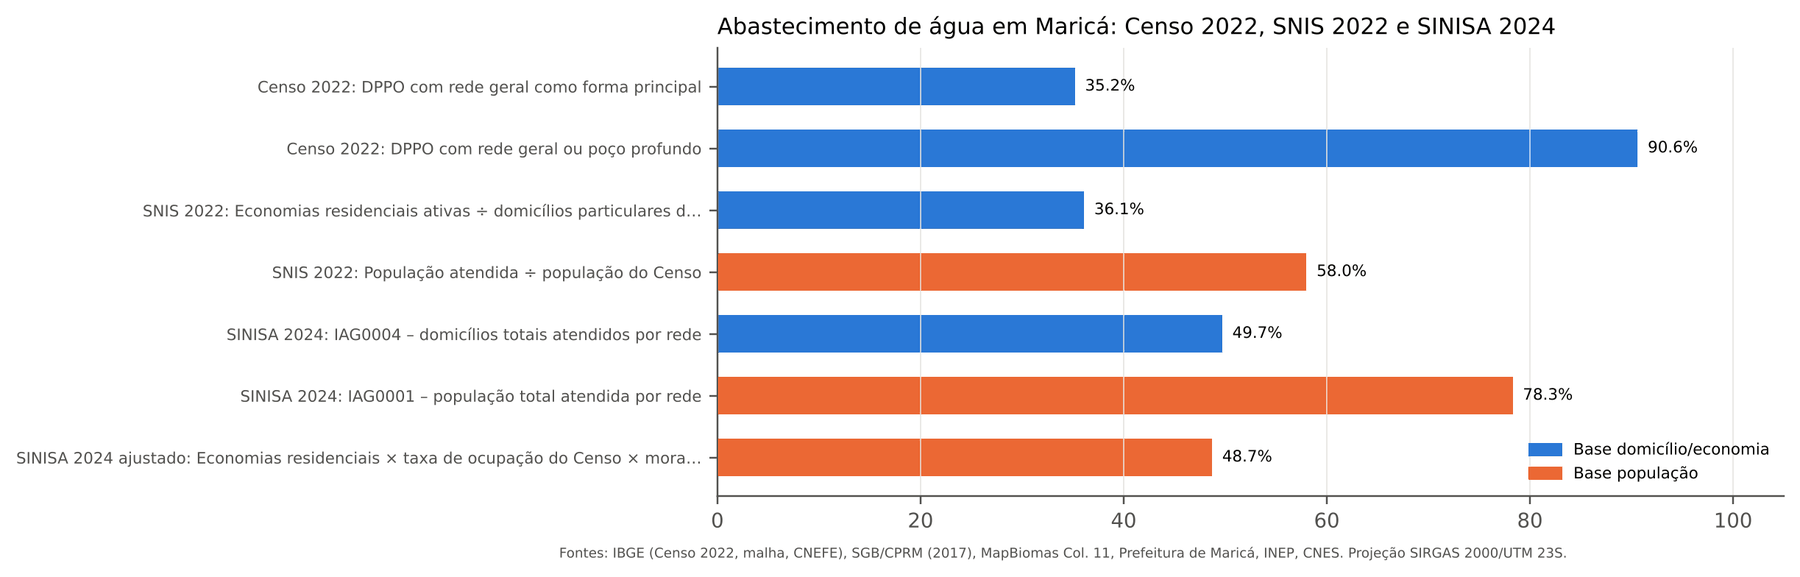
1. The unit. SINISA 2024 itself reports 78.3% of the population served, but only 49.7% of households. The served population is estimated by multiplying active residential connections (the “economies”) by 2.98 residents per economy, more than the Census average (2.69 residents per occupied household). And those economies include occasionally used homes, numerous in a holiday municipality: in the Census, only 69.0% of private households were occupied. Adjusting for those two differences, 2024 population coverage falls to about 48.7%.
2. The year. The water concession changed operators at the end of 2021, and active residential economies went from 38,412 in 2022 (SNIS) to 55,713 in 2024 (SINISA), a 45% increase. In the Census year, SNIS residential economies equal 36.1% of enumerated households. Practically the same 35.2% as the Census.
3. The concept. The Census asks about the main source of water. A household connected to the network that relies mostly on a well because of intermittent supply is counted as a well. And intermittency is not rare in Maricá: SINISA records 76,445 economies affected by systematic interruptions in 2024.
Conclusion: the sources do not contradict each other. They measure different things, in different years, and the Census indicator is consistent with the provider’s registry in the same year. To monitor the concession going forward, it makes more sense to track active connections by tract, from the provider’s registry, than SINISA’s population percentage.
For sewage, the relationship reverses: the Census shows 34.7% of households with sewage in the general network, storm drain or a septic tank connected to the network, while SINISA reports 12.5% of the population with a collection network. This suggests some households declare a connection to the storm drain, which is not a sewage system. The sewage indicator should be read as declared destination, not treatment, which only reinforces the diagnosis of low effective sanitation coverage.
What the index does not say
Before the recommendations, the limits, because a badly read index does more damage than no index:
- It is a multi-layer 2022 reference snapshot, not of today. It combines the 2022 Census, the 2017 susceptibility chart, MapBiomas 2022–2025, the 2024 School Census and 2026 health registries.
- Income is modeled. S1 depends on the lognormal hypothesis. An observed S1 would require IBGE’s restricted-access microdata or CadÚnico aggregated by tract.
- Exposure is not risk. A1 and A2 say how many households are in a susceptible area, not the probability of damage.
- Access is potential. Being 20 minutes’ walk from a USF does not guarantee care, a school place or a safe crossing.
- A tract is not a family. The results describe areas, not people. Inferring a family’s situation from its tract is the old ecological fallacy.
- The weights are hypotheses. Sensitivity shows the prioritization is stable, but it does not replace validation with managers and residents.
And above all: the ICST does not support conclusions about land tenure, irregular occupation or evictions. It indicates where to look first. The decision to intervene requires a technical visit, listening to the population and specific administrative data.
What the results suggest
Within those limits, four recommendations proportional to the quality of the data:
- Sewage first. It is the municipality’s main deficit and is concentrated in Itaipuaçu, the fringes of Inoã and the 2nd district. Expanding the network and adequate individual solutions should start with the Low-Low clusters, where area-based intervention reaches more households at once.
- Family health where it does not reach on foot. Priority tracts with low access are natural candidates for new USFs or mobile teams, after field verification.
- Flooding as Civil Defense’s starting point. About a quarter of households are in an area of high flood susceptibility. Tracts with that indicator elevated are a good start for the detailed risk mapping that legislation requires.
- A baseline for monitoring. The index can track the water and sewage concession and municipal investments, provided it is updated with the same definitions and the same frozen normalization limits, so that comparison over time is fair.
Closing the series
If I had to sum it up in one sentence: you can build an auditable intra-municipal index without fabricating data. IBGE’s suppressed cells became exact intervals, the income that did not exist by bracket was estimated and validated, household location came from the address registry, and every choice went through a sensitivity test.
What remains as a lesson for any territorial analysis is less the final number and more the path: ask where, not just how much; distrust the average; treat missing as missing; and test your own index before asking anyone to trust it.
The natural next steps are to obtain an observed income indicator (IBGE microdata or CadÚnico), incorporate the municipal road base, validate the weights with the people who live and work in these territories and update the index with each new dataset. If you work in planning in Maricá or another municipality and want to talk about the method, get in touch.